
BY MADISON RAE | SQ ONLINE WRITER | SQ ONLINE (2017-18)
_____________________________________________________________________
California is well-known for its strict environmental standards: we see their influence in higher gas prices, decreasing plastic bag and bottle presence, increasing use of reusable products, and numerous national parks and protected areas. Californian state universities and cities like San Francisco are working toward becoming waste-free and zero-emission spaces. Yet, California has recently been rated the worst in air quality in the nation in the American Lung Association’s (ALA) “State of the Air 2017” report. How is this possible?
Some causes of air pollution are preventable, like the burning of fossil fuels, trash, and wood. California is a huge state, and requires a large amount of energy and resources to support its residents: this is one of the driving forces behind our strict environmental regulations. With a population this large, and the rising need for energy and transportation, the state has needed to be able to minimize air pollution from preventable causes.
Some other causes, however, are less preventable. Much of Southern California is essentially a tinderbox – between years of drought and large chunks of grassland and forest, anyone who has ever experienced a California summer knows that wildfires are inevitable. Some years are better, with fires that stay contained and mostly away from homes. Other years, in an almost apocalyptic fashion, ash rains from the sky and people are instructed to stay inside because the air is harmful to breathe.
To combat wildfire-based air pollution, California has a smoke management plan in place. Fire is integral to the life cycles of many native plants throughout the state, so scientists and legislators strive to protect residents while allowing ecosystems to burn and rejuvenate. Extended droughts and warming temperatures due to climate change are providing new obstacles to overcome in the balance of wildfire safety.
_____________________________________________________________________
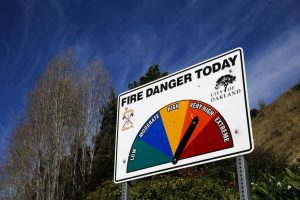
An Oakland fire warning sign in fall 2016.
_____________________________________________________________________
According to the ALA, 91% of Californians “live in counties affected by unhealthy air”. Unhealthy air is defined as harmful ozone levels and high levels of particulates that can be inhaled. San Diego County, particularly Carlsbad, ranked 7th this year for unhealthy ozone levels, but stayed out of the top 25 for short-term and annual particle pollution. Residents who are most sensitive to air quality are also most likely to live in unhealthy counties: California’s youngest and oldest citizens, adults and children with asthma, those living in poverty, and people with conditions like diabetes, heart disease, chronic obstructive pulmonary disease (COPD), and lung cancer are the most vulnerable to poor air quality. California’s largest and most populated cities are also those with the worst air quality, particularly between freeways, industrial work, and wildfires. Highly populated areas are far more prone to pollution and poverty, and present a much more complex situation to improve. Transportation and industry become a necessity to residents, even at the expense of their health. The challenge for California now and in the foreseeable future is to provide options to its residents that are environmentally friendly, health-conscious, and efficient for such a massive population.
_____________________________________________________________________
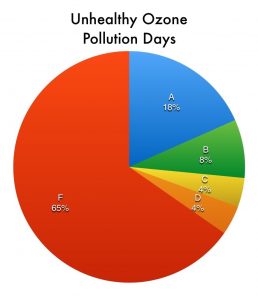
This chart shows the ALA’s ozone pollution grade distribution for 49 of California’s 58 counties. Grades were assigned based on the number of days each county experienced ozone levels that were Unhealthy for Sensitive Groups (greater than 70 parts per billion, or ppb), Unhealthy (greater than 85 ppb), or Very Unhealthy to Hazardous (greater than 105 ppb and 201 ppb, respectively).
_____________________________________________________________________
The California Air Resources Board (ARB) reports all of the state’s statistics for air pollution levels. Along with AirNow, they provide up-to-date information about the air quality of both California and the nation. ARB lists national standards alongside state standards; for ambient air quality, California’s standards are equal to or stricter than national standards for all but lead particulates and hourly nitrogen dioxide. In addition, each year the State of the Air report details every major city and county nationwide that poses danger for its citizens.
_____________________________________________________________________
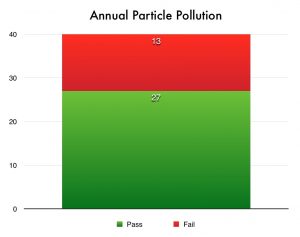
Of the 40 counties graded for annual particle pollution, 68% received a passing grade.
_____________________________________________________________________
As bleak as the situation seems, the State of the Air report shows significant improvement as a national whole, and in each of the California counties that are performing poorly. This year, Los Angeles had a record low of unhealthy air quality days, and the wet winter of this year gives us some hope of reduced wildfire damage throughout the summer and fall. The State of the Air report asserts that while there are still huge obstacles to face, the national standards laid out by the Clean Air Act of 1970 and California’s in-state efforts are improving our air quality. In the case of particle pollution, California’s San Benito and Lake Counties were ranked 22nd and 3rd respectively in the nation’s Cleanest Counties for the lowest long term pollution levels, and Salinas and Redding-Red Bluff Counties were 17th and 14th cleanest in the nation for lowest annual levels. Our methods and legislation are working, and there may be hope that California can provide a safer living environment for all of its citizens in the future.
This article’s featured image is a smoggy LA sunrise in 2013, from a CBS article discussing the State of the Air 2013 Report.
[hr gap=”0″]
Sources:
https://www.sciencedaily.com/releases/2017/06/170619092749.htm
https://www.arb.ca.gov/html/ds.htm
https://www.arb.ca.gov/research/aaqs/aaqs2.pdf
https://www.airnow.gov/index.cfm?action=airnow.local_state&stateid=5&mapcenter=0&tabs=0
https://www.arb.ca.gov/adam
https://www.arb.ca.gov/smp/smp.htmhttp://www.lung.org/local-content/california/documents/sota-2017_ca-overview.pdf
http://www.lung.org/local-content/california/documents/state-of-the-air/2017/sota-2017_ca__most-polluted.pdf
http://www.lung.org/local-content/california/documents/state-of-the-air/2017/sota-2017_ca__californians-at.pdf
http://www.lung.org/local-content/california/documents/state-of-the-air/2017/sota-2017_ca_california-grade-summary.pdf
http://www.lung.org/assets/documents/healthy-air/state-of-the-air/state-of-the-air-2017.pdf
https://www.arb.ca.gov/fuels/gasoline/cbgupdat.htm
http://www.sfchronicle.com/bayarea/article/25-years-later-Oakland-hills-ripe-for-another-9984731.php
https://www.cbsnews.com/news/state-of-the-air-report-finds-improvements-in-us-air-quality-but-smog-problems-persist/
