
INTRODUCTION
Oysters are an integral part of many marine ecosystems. They provide food for several species of snails and crabs and act as natural water filters, preventing algal blooms and nutrient-induced oxygen depletion in aquatic ecosystems (eutrophication). Additionally, oyster reefs provide a habitat for several small fish and crustacean species. Lastly, they promote underwater vegetation growth, providing greater coastal resistance to erosion and protection against storms. In recognition of the significance of oysters in promoting marine biodiversity, countries such as the United States and Australia have invested millions of dollars in the restoration of oyster reefs along the Pacific, Atlantic, and Indian ocean coasts.
A microbiome is a consortium of bacteria, fungi and other microbes associated with a host organism, such as the Pacific Oyster. By evaluating differences in the microbiome of various oyster tissue types from multiple geographic regions, our goal is to develop a deeper understanding of the factors that influence oyster microbiome composition and diversity and the core microbial taxa that may play an important role in oyster health. Numerous papers have indicated that doing so could help identify interactions between taxa and potentially their influence on oyster community composition as well. We chose to analyze the Pacific Oyster (Crassostrea gigas) microbiome, as this species dominates global shellfish production and is a prominent member of Pacific Ocean coastal ecosystems. Several individual studies have characterized Pacific Oyster microbiomes from multiple regions; however, a meta-analysis has not previously been conducted. In this analysis, we have compiled data from 10 studies representing several countries, multiple oyster tissue types, and in some cases experimental manipulations such as infection and translocation. A meta-analysis was conducted by combining data from multiple studies as by doing so it is often possible to identify more reliable trends than by comparing the results of individual analyses. We utilized the open-source microbial analysis platform Qiita to gain new insight into Pacific Oyster microbiomes and to generate a tool for the scientific community, enabling future studies of new testable hypotheses. After reading papers utilized in the meta-analysis, we hypothesize that bacteria belonging to the Mycoplasmataceae and Spirochaetes family will be common dominant taxa across all geographic regions. Several papers have attributed oyster microbiome fluctuations to environmental changes. These studies found that some tissue types are more affected than others, particularly finding that gut taxonomic evenness and abundance varied the most by tissue type. Therefore, we also hypothesize that the core microbiome, particularly that of the gut, would be very small. A small core microbiome suggests a significant level of variation in taxonomic abundance and diversity for a given tissue type between samples.
METHODS
We identified peer reviewed studies associated with Pacific oysters (Crassostrea gigas, also known as Magallana gigas) and their microbiome using relevant search terms in Google Scholar and Connected Papers, a citation-based paper identification tool. Studies were then inspected individually, and those that did not use 16S rRNA Illumina amplicon sequencing were excluded from the analysis. Studies were also excluded if sequences were unavailable publicly or by author correspondence. Data were obtained from 10 studies and processed in the open-source microbial analysis platform Qiita.12 For each study, a metadata document was created using all supplementary information provided in the paper. The primary variables were sample name, research project, sample site, country of sampling, the hypervariable region of the 16S rRNA gene sequenced, sampling season, month and year, and additional variables were added to account for all unique environmental conditions and treatments that samples in different studies were subject to (such as infection and translocation). All raw data were downloaded as FASTQ files from the European Nucleotide Archive. Based on the sample name and the run prefix for the raw data files, a preparation information file was created. The metadata, preparation information, and raw data were then uploaded to Qiita for further processing and made available for public use (Analysis ID: 46943).
The metadata variables were kept constant for a consistent meta-analysis. Each study was uploaded as a per-sample FASTQ without barcodes, and demultiplexed using the ‘Split Libraries Fastq’ command with a Phred quality score offset of 33. All sequences were trimmed to a length of 250 base pairs, followed by closed-reference OTU picking against the SILVA 119 database. This gave rise to a BIOM feature table for each study, which was combined for subsequent meta-analysis. The combined feature table underwent taxonomy-based feature table filtering to remove sequences annotated as mitochondria, chloroplasts, eukaryotic species, archaea, and any unknown or unclassified species. Beta diversity and Kruskal-Wallis pairwise beta group significance tests were performed on the filtered table to determine whether the difference in microbiome between samples was significant. Bray-Curtis dissimilarity was used as a metric for beta diversity, the results of which were also graphed on a Principal Coordinate Analysis (PCoA) plot (Figure 2). Alpha diversity analysis was then performed on the filtered table, using Shannon’s diversity index as the metric, the results of which were displayed on a box plot (Figure 3).
The next part of the analysis focused on visualizing the microbiome and potentially identifying a core microbiome for each tissue type. The filtered feature table underwent sample filtering to produce a separate table for each tissue. The tables were collapsed by taxonomy to the family level (level 4) to quantify the relative abundance of each taxa in the samples. To identify the core microbiome of a tissue type, we ran the ‘identify core features’ process on the feature table after collapsing the filtered table according to taxonomy. We then looked at the various taxa found in 100%, 95%, and 90% of samples for each tissue type respectively, and considered 95% to be the benchmark for classifying a taxon as ‘core’. King and colleagues defined ‘core’ to be “an OTU that was present in at least all but one replicate,” but considering the large variability in number of samples for each tissue type, we considered this to be an impractical definition for this study. The high accuracy levels associated with Illumina amplicon sequencing have allowed the definition of core to extend to taxa that are found in 100% of samples, but to account for variability in the large number of different samples being analyzed, we reduced the threshold to 95%.
RESULTS
A total of 1,896 oyster samples from several anatomical and geographical sites were analyzed from 10 studies for this meta-analysis. The tissue types evaluated were gut, gill, whole oyster homogenate, extrapallial fluid, mantle, main cavity, adductor muscle, feces, and hemolymph. All samples are either from the west coast of the United States (California), Australia, the Netherlands, France, or Germany. Illumina HiSeq sequencing platforms were used for sequencing extrapallial fluid and main cavity samples, whereas MiSeq sequencers were used for all other tissue types. Although it was included in this study due to a different sequencing approach, the main cavity has been excluded from all further analyses as only one sample was available.
Beta Diversity Across All Samples
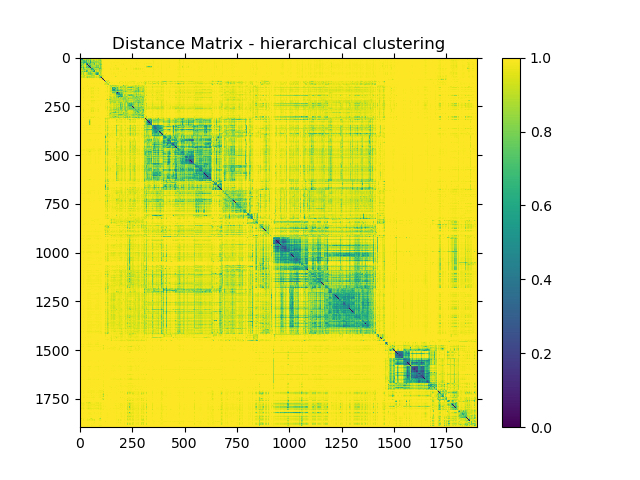
Hierarchical clustering of pairwise beta diversity comparisons using the Bray Curtis dissimilarity metric across all samples revealed that most samples were highly dissimilar to each other, with limited clustering of certain sample types (Figure 1). Most dissimilarity values lie in the distance range of 0.9 to 0.95. The average distance was 0.9435, with the maximum distance being 1.0000 and lowest being 0.0566.
Beta Diversity Group Significance and Pairwise Beta Diversity Analysis Within Sample Types
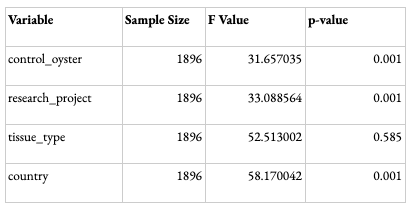
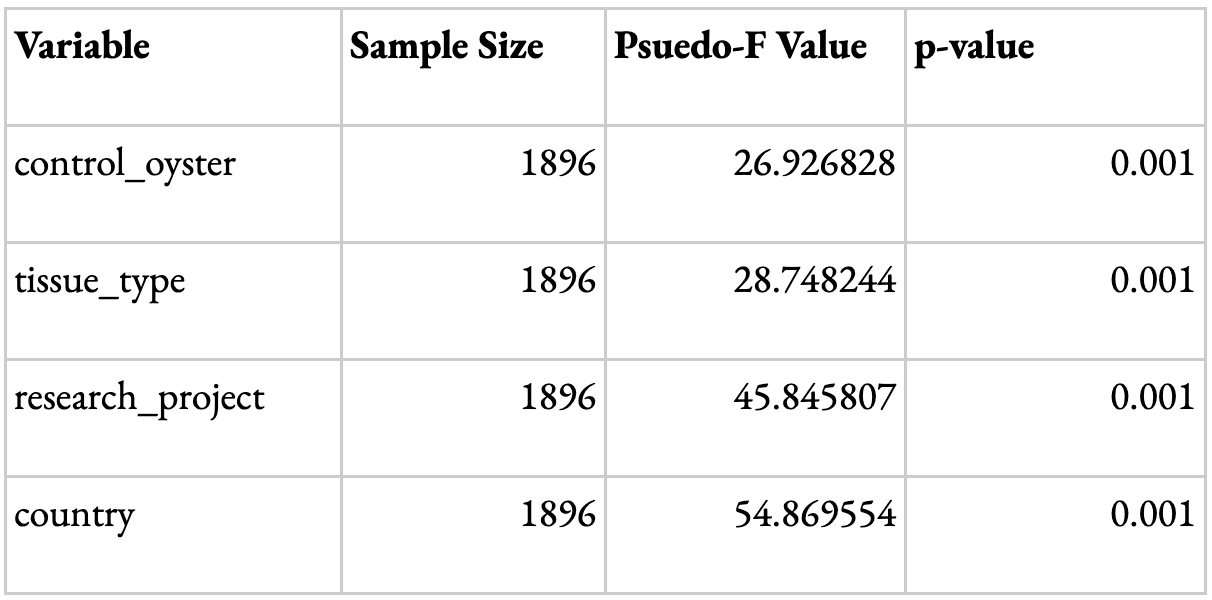
In order to validate the meta-analysis, PERMDISP and PERMANOVA Beta Diversity group significance analyses were conducted to look at the key determining factors driving the differences in results. The variables looked at were the research project, tissue type, country, and type of oyster (control or not). A p-value <0.05 suggests that the variable has a statistically significant influence on the data obtained. The dispersion for all variables with the exception of tissue type was considered statistically significant (Table 1). This could be because most studies with available data were focused towards specific tissue types, such as gut or gill. Other tissue types, such as extrapallial fluid and mantle, were less common; therefore, the dispersion of tissue types was not necessarily a driving factor. The difference in composition between samples for each variable shown through the PERMANOVA results was statistically significant (Table 2). Although the influence of dispersion and composition on the basis of research projects is significant, the remarkably higher F and pseudo F value (Tables 1 and 2) for the ‘country’ variable suggests that, while study may influence the data, the geographic region is the main driving factor for the results. This validates the data, as it suggests that differences in study design or hypervariable region sequenced, for instance, are not the primary drivers of the differences observed among samples.
A beta diversity group significance boxplot using the Bray-Curtis dissimilarity metric was used to evaluate whether the difference in microbiomes across different tissue types was significant. Mean distances were at or close to 1 for all tissue types in comparison to each other. The level of variation in distance between the gill and mantle tissue was higher than between all other tissue types, indicating that the gill and mantle microbiome may have greater similarity compared to other samples.
A pairwise beta diversity group significance PERMDISP test was conducted on the samples according to tissue type to generate a statistical metric that quantifies the level of dispersion between these different tissue types. A p-value <0.05 is considered statistically significant, and comparison between tissue types assumes that the groups are similarly dispersed. Despite the boxplots showing relative similarity between the gill and the mantle microbiome, the pairwise analysis indicated a significant difference between them. There were no significant differences between the adductor and gut or gill, the feces and mantle or whole oyster, and the extrapallial fluid and feces, hemolymph, mantle, or whole oyster samples. All other pairwise combinations were significantly dispersed from each other.
While these differences in group homogeneity may impact group statistical comparisons and should be appropriately considered, PERMANOVA non-parametric tests under similar assumptions. A p-value <0.05 indicates that the difference in composition between the two tissue types is statistically significant. Therefore, apart from extrapallial fluid, all compared sample types were statistically different.
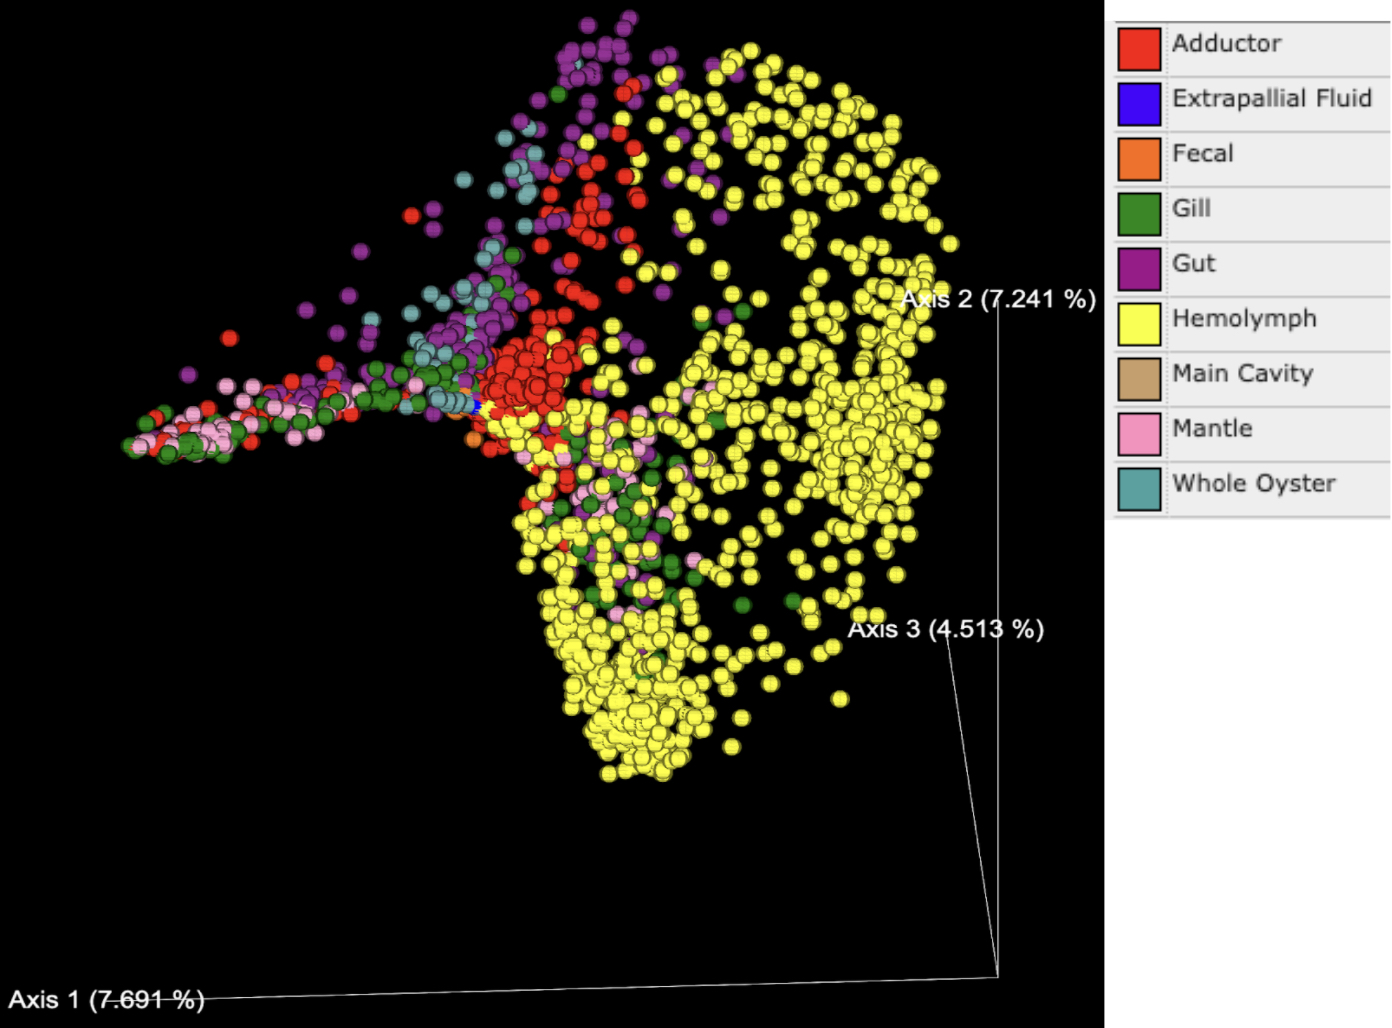
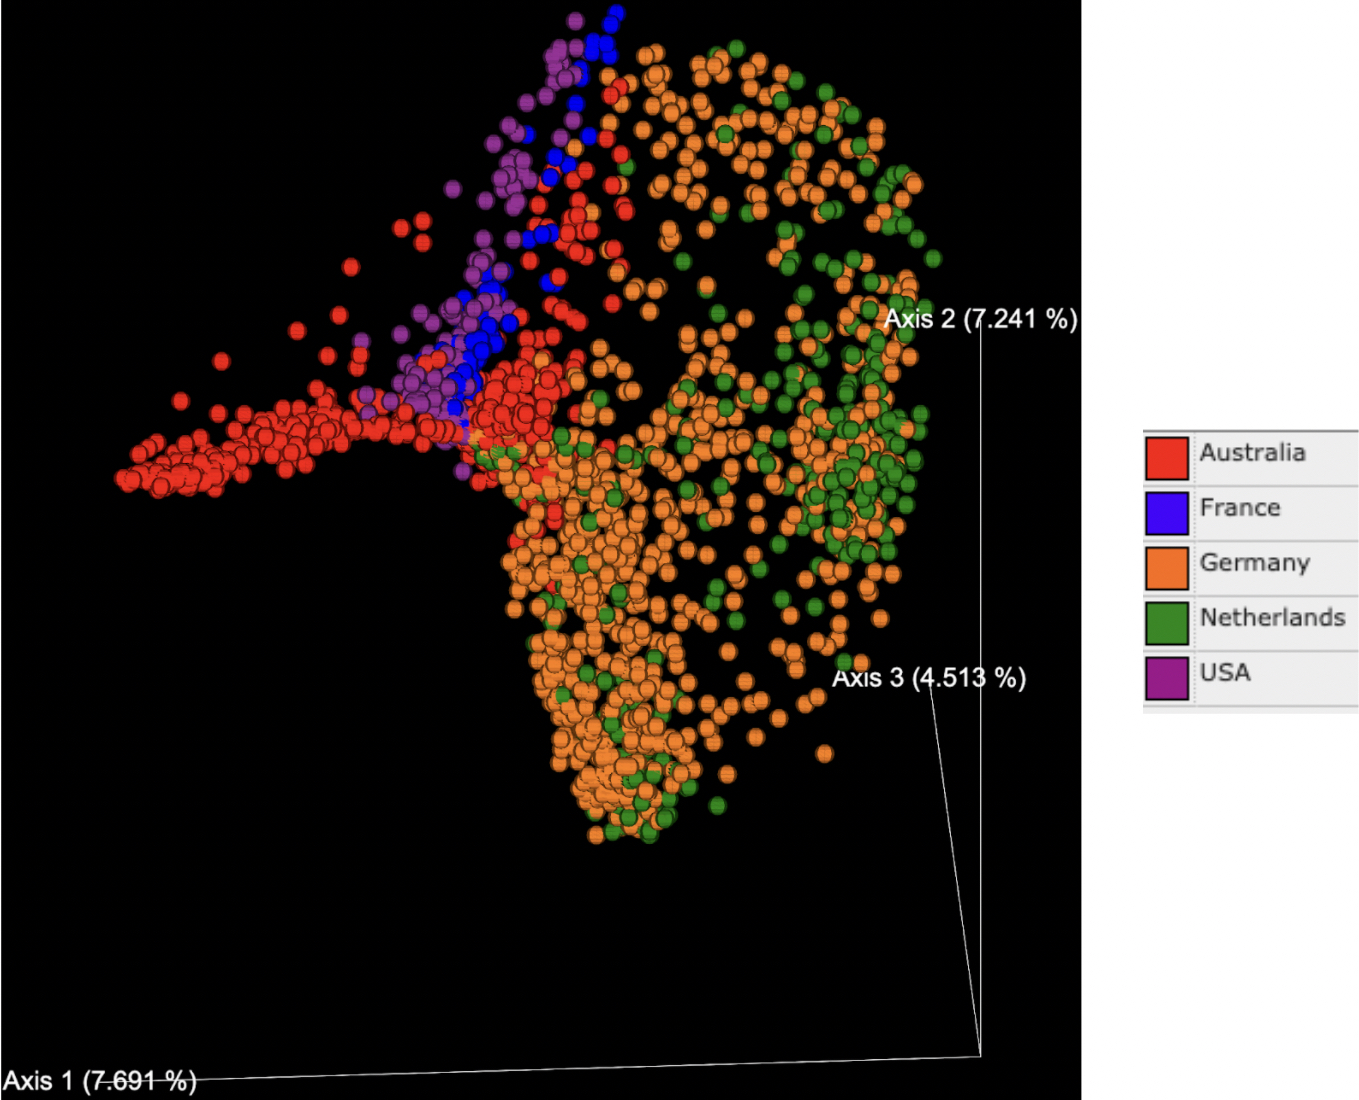
PCoA plots generated based on the Bray Curtis dissimilarity matrix indicated that the percentage of variance explained ranged from 4-8% for each axis, with a total of 19.45% explained by the three primary axes shown (Figures 2 and 3). Tissue types (denoted by color in Figure 2) formed distinct clusters in some cases. Data points on the whole oyster, mantle, adductor, gut, and gill were widely dispersed, suggesting higher microbiome variability in these tissue types. Hemolymph and fecal samples were clustered together and away from other sample types, suggesting that they were most likely to have a distinct but robust microbiome composition. Extrapallial fluid samples were centrally located on the graph and close to all tissue types, suggesting that it may share features with other tissue microbiomes.
While tissue type was a strong driver of microbiome beta diversity, geographic location of the study also played a large role. Samples often clustered together based on geographic region (Figure 3) and in some cases this more strongly influenced community similarity than sample type (Figure 2); for example, digestive gland samples from southern California were more similar to other southern California tissue samples than to digestive gland samples from other geographic regions (Figures 2 and 3). Likewise, the adductor, gut and mantle samples from Australia were more similar to each other than other samples of the same tissue type from different regions (Figures 2 and 3). Additionally, the distance between samples from Germany and other countries in Europe has a greater difference in microbiome relative to the USA or Australia than the difference between samples from the USA and Australia (Figure 3). There is no significant difference in microbial abundance between samples from the Netherlands and Germany (Figure 3). Samples from France are well scattered, being close to gut samples from the United States, Australia and Germany, as well as adductor samples (Figure 3).
Beta diversity group significance tests confirmed community similarities based on tissue type and geographic location. We observed these group differences in the PCOA plot, and also saw significant differences upon running the group pairwise PERMANOVA significance tests.
Alpha Diversity
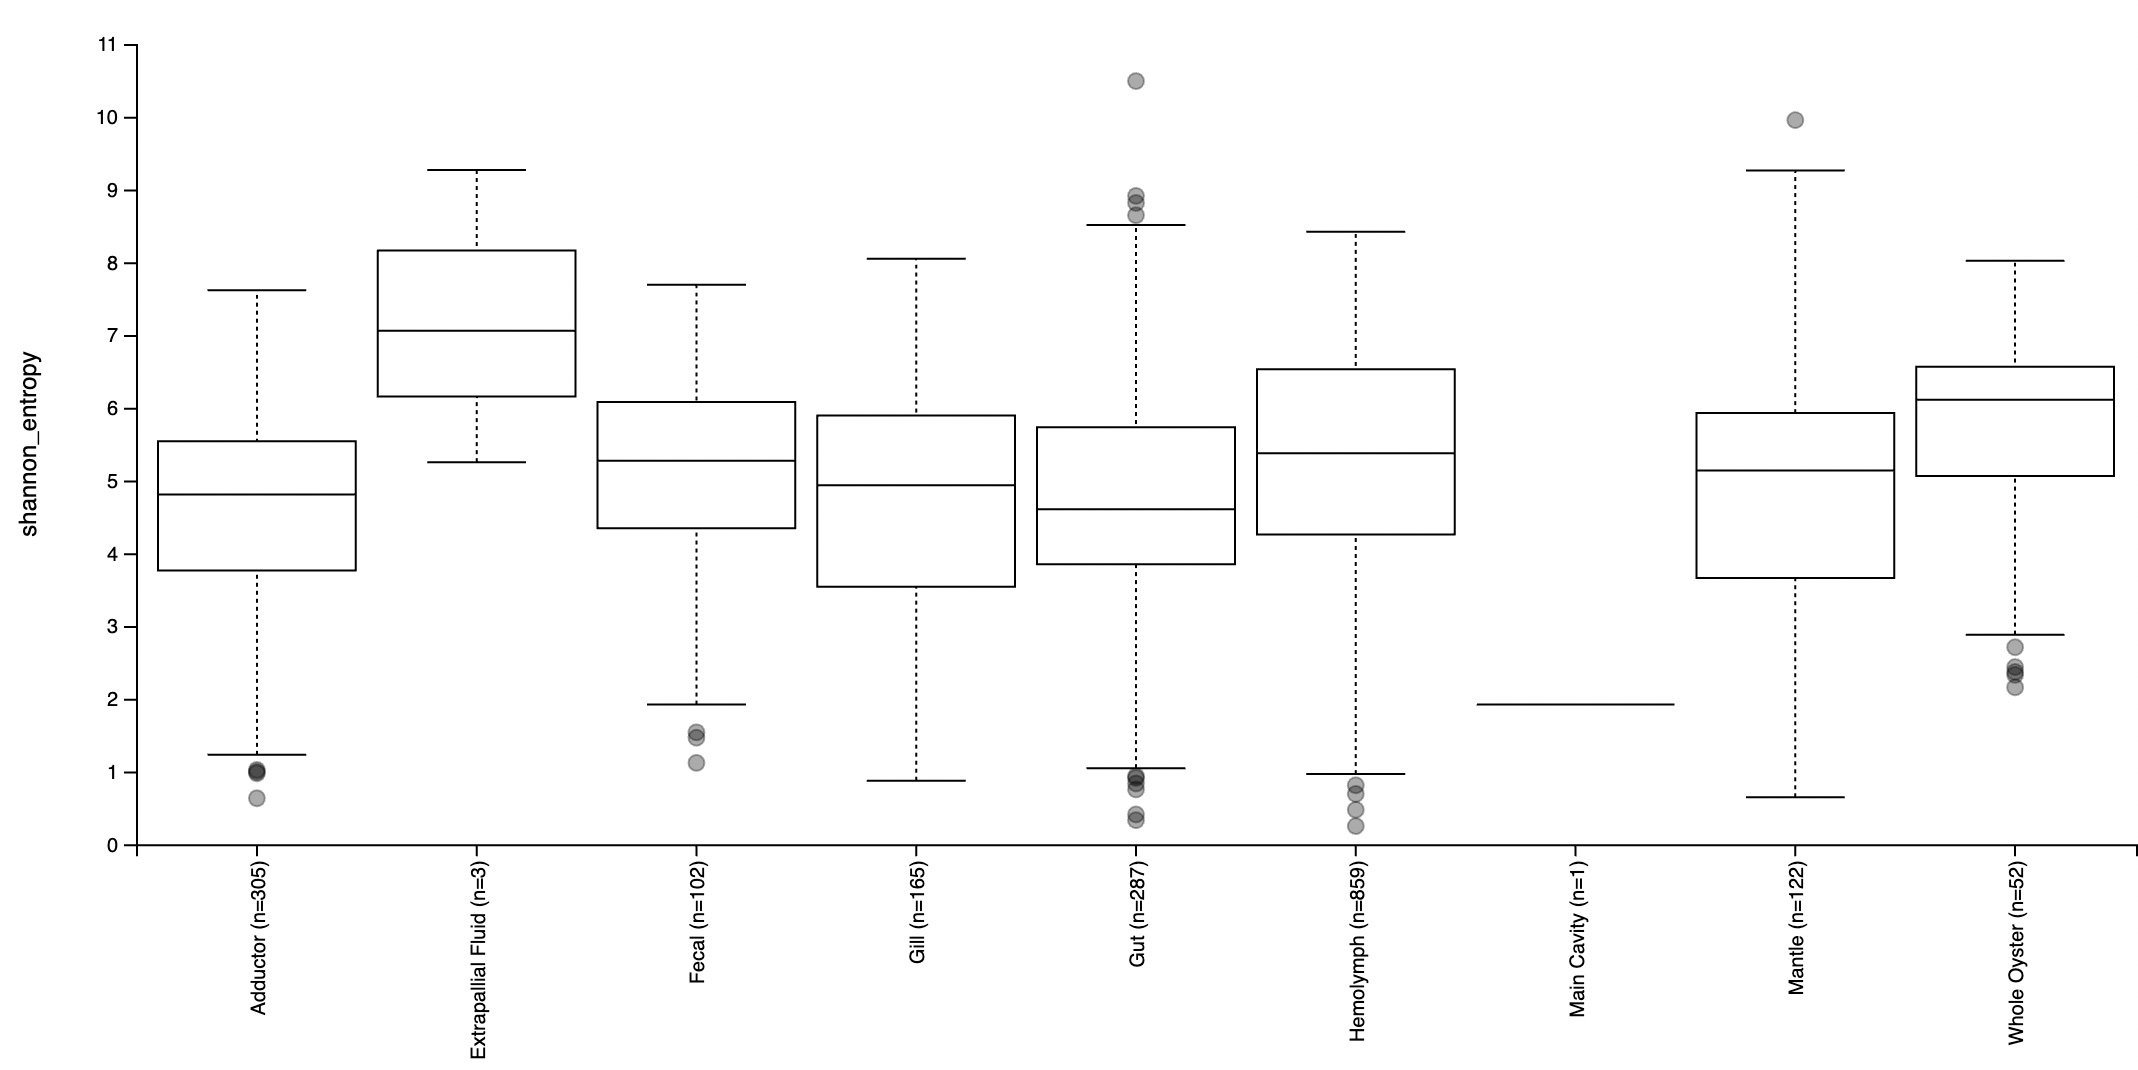
An alpha diversity plot based on the Shannon diversity metric was created to investigate the richness of species in the microbiome within each tissue type, and its respective variation (Figure 4). This is a metric that multiplies the proportion of species with the natural log of the respective proportions to account for both evenness and abundance of microbial species when determining richness. While abundance solely refers to the number of different species present in each tissue type, evenness refers to how similar the abundance of each species is across geographic regions. All tissue types except for extrapallial fluid had significant variation in diversity. In this case, Shannon entropy refers to the level of uncertainty as a result of variation in diversity results, considering that samples collected from each site were random. The majority of them had mean Shannon entropy in the range of 4.5-7, suggesting a moderate to high general level of variation in biodiversity within tissue types. The greatest range in entropy values were observed in gut samples. Extrapallial fluid had the greatest mean entropy, followed by whole oyster and hemolymph. The gut had the lowest entropy, followed by the adductor. This suggests that extrapallial fluid had the greatest variety of species in its microbiome, whereas the lowest was the gut, followed by the adductor.
Core Microbiome
Rhodobacteraceae, Flavobacteriaceae and Alteromonadaceae were the most common bacterial families and formed the ‘core’ microbiota (represented in >95% of all samples). Alteromonadaceae was only found to be a core taxon in 6 of the 9 tissue types investigated. Tissue types displayed a varied range of taxa in their core microbiomes, with some such as the hemolymph having 13 core taxa. Most of the tissue types followed a linear or exponential pattern of decreasing taxonomic features relative to the fraction of samples, except for extrapallial fluid. Extrapallial fluid had the largest core microbiome, with 86 taxa being identified in 95% samples of each tissue type. This is much higher than fecal samples, which have a feature count of 14 and are the second highest. With two features in 95% of the samples, the gut had the smallest core microbiome. The only core taxa belonged to the Mycoplasmataceae and Rhodobacteraceae family; while Rhodobacteraceae was core for all samples, Mycoplasmataceae was only a core taxon in whole oyster and gut samples. Vibrionaceae was a core taxon in mantle, hemolymph, extrapallial fluid and fecal samples. Rhodobacteraceae and Flavobacteriaceae were found to be in the core microbiome for all tissues.
Some taxonomic groups were notably common and of relatively high abundance. Mycoplasmataceae, Spirochaetaceae, and Vibrionaceae, for instance, were among the top ten bacteria in terms of frequency among samples from all geographical and anatomical sites. However, these bacteria were not a part of the core microbiome. While Spirochaetaceae dominated the mantle and gill microbiome frequencies, it is interesting to note that in both tissues, they were not found in more than 35% of samples. Mycoplasmataceae were the most frequent taxa in hemolymph and gut samples, with its frequency being more than double the second most frequent taxa in the gut. Unlike the Spirochaetaceae dominance in gill and mantle tissues, Mycoplasmataceae was found in almost all gut samples and in more than 90% of hemolymph samples. Vibrionaceae had the highest frequency in adductor muscles, followed by Spirochaetaceae. While Vibrionaceae was found in 80% of the samples, Spirochaetaceae was in less than half of all samples. Rhodobacteraceae were the most frequent taxa in whole oyster and fecal samples and were found in all samples for both tissues. The extrapallial fluid had the most unique frequent taxa, with Corynebacteriaceae being the most common in extrapallial fluid. These taxa were not in the list of most frequent taxa for any other sample types.
DISCUSSION
The results of this meta-analysis suggest that oyster microbiomes vary significantly based on geographic region. Samples from the same continent were similar, indicated by clusters from the same region on the PCoA plot (Figure 3). Although individual factors such as temperature and salinity were not reported in the studies, the varying taxonomic abundances across geographic regions may be linked to environmental variability. Samples from the United States and Australia were closer to each other than they were to the Netherlands and Germany (Figure 2). Oyster samples for the former were obtained from sites next to the Pacific Ocean and the latter obtained from Wadden Sea, suggesting that oysters from similar environments tend to cluster together. A major contributor to this could be food sources. For instance, an analysis conducted by Simons and colleagues displayed a significant rise in the relative abundance of Vibrio in oyster fecal samples upon consumption of Tetraselmis algae.¹⁴ Additionally, environmental conditions such as pH and salinity have previously been shown to influence animal microbiomes. For example, studies have shown variations in ocean acidification at different regions affecting nutrient cycling and influencing the oyster microbiome. Different geographic regions may also feature genetically distinct Pacific oyster populations. Oyster host genetics have displayed a role in resistance to viral infection and may also influence host-microbiome interactions. Thus, distinct environmental and/or host genetic factors are likely linked to geographic distribution and have a significant impact on the oyster microbiome composition. Disentangling the interconnected effects of host genetics and environmental variability on microbiome composition is an important focus for future research.
Tissue types also significantly influence taxonomic composition. Gut samples showed the highest levels of variation (Figure 2) and the smallest core microbiome, influencing geographical clustering as well. For instance, as seen in the PCoA plot (Figure 3), samples from France did not cluster with other samples from Europe (i.e. Germany and Netherlands), as they were all gut samples. As tissue type was highly scattered (Figure 2), if samples of a tissue type with a larger core microbiome were collected from France and analyzed, they would be more likely to be similar to samples from Germany and the Netherlands than their Pacific counterparts. Previous studies have shown that a shift in environmental conditions or specific microbial taxa can impact oyster health. This could explain the observed differences in the microbiome composition for certain tissue types in the present study, although the exact mechanism that causes this change is unknown and is an important question to investigate in future research.
Investigation of core microbiomes and dominant microbial taxa among tissue types also supported characteristic signals within specific oyster microbial communities. Rhodobacteraceae, Flavobacteriaceae, and Alteromonadaceae were the most common families of taxa in the study, found in 95% of all samples. Studies have speculated that species belonging to the Flavobacteriaceae family have a specialized role in the decomposition of organic matter, and that species belonging to the Alteromonadaceae family play a role in oyster larvae development. Some genera belonging to the Rhodobacteraceae family, such as Roseobacter, have been found to play a major role in low-level nutrient enrichment for the establishment of microhabitats and cell-cell communication, suggesting that these microbes can play a role in the establishment of oyster reef microhabitats. While other studies have acknowledged the abundant presence of such families in oysters, the roles of Rhodobacteraceae and Flavobacteriaceae bacteria in oysters are yet to be understood and explored.
Although the results indicate that tissue types have similar microbial features, the low number of core taxa in sample types such as gut, gill, and adductor samples make it difficult to define a core microbiome in these tissue types. This suggests that environmental changes and other factors may have a greater influence on these specific microbiomes, but less influence on other tissue or sample types which are more stable. Additionally, although extrapallial fluid has the largest core microbiome, it is important to note that the low number of samples were all from the same sample site and study, making it difficult to compare the stability of its microbiome to other sample types with greater representation. Likewise, the main cavity sample type is only represented by one sample. More research would therefore have to be conducted on low variability or underrepresented sample types to identify their potential core microbiomes.
Analysis of the 10 most frequent taxa for each tissue type revealed that although many dominant taxa were not part of the core microbiome for all tissue types, they may still play an important role in microbial ecology and potentially oyster health. For instance, Spirochaetaceae is the most frequently observed family of taxa in mantle tissues overall, even though it is only found in 69 of the 122 samples analyzed. This finding is supported by other studies and could be an indicator of infection. A study conducted by Matsuyama and colleagues on the Akoya pearl oyster (Pinctada fucata martensii) microbiome showed that genes of bacteria belonging to phylum Spirochaetes were only found in the mantle of oysters infected with Akoya Oyster Disease (AOD), an infection that stunts pearl oyster growth and causes significant oyster mortality every year.27 This suggests an important functional role for these microbes, despite the high variability in microbiome composition observed across studies, which may be related to study-specific factors including environmental variables and infection status.
We also observed abundance correlations between several potentially ecologically important microbial taxa. For example, tissues with high Mycoplasmataceae frequency tend to have a relatively lower Vibrionaceae frequency, even though the number of samples in which they are found does not change largely. In gut samples, for instance, while the family Mycoplasmataceae has a frequency of 2,007,689, Vibrionaceae only has a frequency of 267,134. Studies have shown that taxa belonging to the Vibrionaceae family found in other sample types as well are associated with oyster mortality and cause vibriosis in humans, suggesting that these taxa could be potential keystone indicators of oyster health and their pathogenicity towards humans. King and colleagues conducted groundbreaking research in 2018 on the pacific oyster microbiome in Australia that displayed Mycoplasma to be dominant in the adductor muscles of healthy oysters, as well as a surge in Vibrio concentrations in diseased oysters.²⁴ This study reinforces the idea that Vibrio-Mycoplasma ratios could potentially be key indicators of oyster health. However, further research must be conducted to understand the relationship between these taxa, and the mechanisms they use to protect or infect oysters.
CONCLUSIONS & FUTURE DIRECTIONS
The Pacific oyster microbiome is a complex system that remains poorly understood. The purpose of this meta-analysis was to draw on several recent studies in order to identify major factors that may influence tissue-specific oyster microbiomes from diverse regions and the potential importance of microbial taxa in oyster health. We observed that both geographic variability and sample type influenced taxonomic abundance and community composition. Additionally, variables rarely examined in oyster microbiome studies, including the environment and host genetics, may play a significant role in oyster microbiome variability. As these studies were limited to only four countries, in order to have a greater understanding of the effect of geographic location, samples from regions such as Japan, New Zealand, and other European countries must be analyzed as well in order to thoroughly understand this field. More studies on infected, translocated, and heat-shocked oysters must be conducted to identify potential links between such factors and the microbiome. Furthermore, environmental factors such as temperature, salinity, and nutrient concentrations must be quantified. This way, differential abundance tools such as Songbird and DEICODE can be used to visualize change in taxonomic abundance in accordance with various environmental factors, helping us understand the extent to which each factor influences the abundance of specific microbiota.
The results of this study reinforce previous suggestions that particular core or abundant microbial taxa may play a role in determining oyster health. Further research must be conducted to understand their mechanisms and individual effects on the microbiome; this could focus on keystone taxa which could be additional indicators of oyster health. Looking at the ratio of relative abundance between two species within oysters could potentially help with identifying oyster symbionts and pathogens, possibly making it an exceptional indicator of oyster health. To extend understanding of how oyster microbiomes are linked to human health, metadata collected during future oyster microbiome analyses could be extended to include quantification of human pathogens, particularly those of marine origin such as Vibrio spp., which are known to accumulate in oysters. A significant amount of financial investment is therefore needed, combined with an in-depth understanding of host-microbe interactions and microbial dynamics, to make accurate conclusions on the oyster microbiome and bridge the knowledge gaps there are today.
ACKNOWLEDGEMENTS
We would like to thank UC San Diego PhD student Carolina Carpenter for her assistance in validating the meta-analysis.
REFERENCES
- Office of Habitat Conservation. “Oyster Reef Habitat.” NOAA, 27 July 2020, www.fisheries.noaa.gov/national/habitat-conservation/oyster-reef-habitat.
- Caruso, Lisa. “CBF Welcomes Fiscal 2021 Oyster Restoration Funds in Bill Approved by House Appropriations Committee.” Chesapeake Bay Foundation, 13 July 2020, www.cbf.org/news-media/newsroom/2020/federal/cbf-welcomes-fiscal-2021-oyster-restoration-funds-in-bill-ap-
proved-by-house-appropriations-committee.html#:~:text=The%20Corps%20will%20use%20the,restoration%20budget%20is%20%245%20million. - The Nature Conservancy.“Rebuilding Australia’s Lost Shellfish Reefs.” The Nature Conservancy Austraila, 1 June 2020, www.natureaustralia.org.au/what-we-do/our-priorities/oceans/ocean-stories/restoring-shell-fish-reefs.
- Brennan, Dan. “Oysters: Are They Good for You? Pros and Cons, Nutrition Information, and More.” WebMD, WebMD, 29 Sept. 2020, www.webmd.com/diet/oysters-good-for-you#:~:text=Oysters%20are%20a%20rich%20source,be%20more%20effective%20than%20supplements.
- Pimentel, Zachary T., et al. “Microbiome Analysis Reveals Diversity and Function of Mollicutes Associated with the Eastern Oyster, Crassostrea Virginica.” MSphere, 2021.
- King, Gary M., et al. “Analysis of Stomach and Gut Microbiomes of the Eastern Oyster (Crassostrea Virginica) from Coastal Louisiana, USA.” PLoS ONE, vol. 7, no. 12, 2012.
- Boettcher, Katherine J., et al. “Roseovarius Crassostreae Sp. Nov., a Member of the Roseobacter Clade and the Apparent Cause of Juvenile Oyster Disease (JOD) in Cultured Eastern Oysters.” International Journal of Systematic and Evolutionary Microbiology, vol. 55, no. 4, 2005, pp. 1531–1537.
- “Oysters and Vibriosis.” Centers for Disease Control and Prevention, Centers for Disease Control and Prevention, 22 June 2021, www.cdc.gov/foodsafety/communication/oysters-and-vibriosis.html.
- Wendling, Carolin C et al. “Persistence, seasonal dynamics and pathogenic potential of Vibrio communities from Pacific oyster hemolymph.” PloS one vol. 9,4 e94256. 11 Apr. 2014.
- Harris, Jill. “Aquatic Invasive Species Profile: Pacific Oyster, Crassostrea Gigas (Thunberg, 1793) .” University of Washington, Dec. 2008.
- Gonzalez, Antonio, et al. “Qiita: Rapid, Web-Enabled Microbiome Meta-Analysis.” Nature Methods, vol. 15, no. 10, 1 Oct. 2018, pp. 796–798.
- King, William L., et al. “Variability in the Composition of Pacific Oyster Microbiomes across Oyster Families Exhibiting Different Levels of Susceptibility to OSHV-1 Μvar Disease.” Frontiers in Microbiology, vol. 10, 2019.
- Hernandez-Agreda, Alejandra, et al. “Defining the Core Microbiome in Corals’ Microbial Soup.” Trends in Microbiology, vol. 25, no. 2, Feb. 2017, pp. 125–140.
- Simons, Ariel Levi, et al. “High Turnover of Faecal Microbiome from Algal Feedstock Experimental Manipulations in the Pacific Oyster (Crassostrea Gigas).” Microbial Biotechnology, vol. 11, no. 5, 2018, pp. 848–858.
- Stevick, Rebecca J., et al. “Functional Plasticity in Oyster Gut Microbiomes along a Eutrophication Gradient in an Urbanized Estuary.” Animal Microbiome, vol. 3, no. 1, 2021.
- Scanes, Elliot et al. “Climate Change Alters the Haemolymph Microbiome of Oysters.” Marine Pollution Bulletin, vol. 164, Mar. 2021, p. 111991.
- Bernatchez, S. et al. “Seascape genomics of eastern oyster (Crassostrea virginica) along the Atlantic coast of Canada” Evol Appl. 2019; 12: 587– 609.
- de Lorgeril, J. et al. “Immune-suppression by OsHV-1 viral infection causes fatal bacteraemia in Pacific oysters” Nat Commun 9, 4215 (2018).
- Pathirana, E., et al. “The Role of Tissue Type, Sampling and Nucleic Acid Purification Methodology on the Inferred Composition of Pacific Oyster (Crassostrea Gigas) Microbiome.” Journal of Applied Microbiology, vol. 127, no. 2, 2019, pp. 429–444.
- King, William L., et al. “Oyster Disease in a Changing Environment: Decrypting the Link between Pathogen, Microbiome and Environment.” Marine Environmental Research, vol. 143, Jan. 2019, pp. 124–140.
- De Lorgeril, Julien, et al. “Immune-Suppression by OSHV-1 Viral Infection Causes Fatal Bacteraemia in Pacific Oysters.” Nature Communications, vol. 9, no. 1, 11 Oct. 2018.
- Fernández-Gómez, Beatriz, et al. “Ecology of Marine Bacteroidetes: A Comparative Genomics Approach.” The ISME Journal, vol. 7, no. 5, 10 Jan. 2013, pp. 1026–1037.
- Dubé, Caroline Eve, et al. “Microbiome of the Black-Lipped Pearl Oyster Pinctada Margaritifera, a Multi-Tissue Description With Functional Profiling.” Frontiers, Frontiers, 5 Jan. 2019, www.frontiersin.org/articles/10.3389/fmicb.2019.01548/full#B67.
- Dang, Hongyue, et al. “Cross-Ocean Distribution of Rhodobacterales Bacteria as Primary Surface Colonizers in Temperate Coastal Marine Waters.” Applied and Environmental Microbiology, vol. 74, no. 1, 17 Dec. 2020, pp. 52–60.
- Laroche, Olivier, et al. “Understanding Bacterial Communities for Informed Biosecurity and Improved Larval Survival in Pacific Oysters.” Aquaculture, vol. 497, 2018, pp. 164–173.
- Arfken, Ann, et al. “Denitrification Potential of the Eastern Oyster Microbiome Using a 16S Rrna Gene Based Metabolic Inference Approach.” PLOS ONE, vol. 12, no. 9, 2017.
- Matsuyama, Tomomasa, et al. “A Spirochaete Is Suggested as the Causative Agent of AKOYA Oyster Disease by Metagenomic Analysis.” PLOS ONE, vol. 12, no. 8, 2017.
- Petton, Bruno, et al. “The Pacific Oyster Mortality Syndrome, a Polymicrobial and Multifactorial Disease: State of Knowledge and Future Directions.” Frontiers, Frontiers, 18 Feb. 2021, www.frontiersin.org/articles/10.3389/fimmu.2021.630343/full.
- Froelich, Brett A., and Rachel T. Noble. “Vibrio Bacteria in Raw Oysters: Managing Risks to Human Health.” Philosophical Transactions of the Royal Society B: Biological Sciences, vol. 371, no. 1689, 2016.
- King, William L., et al. “Characterisation of the Pacific Oyster Microbiome during a Summer Mortality Event.” Microbial Ecology, vol. 77, no. 2, 10 July 2018, pp. 502–512.
- Morton, James T., et al. “Establishing Microbial Composition Measurement Standards with Reference Frames.” Nature Communications, vol. 10, no. 1, 2019
- Martino, Cameron, et al. “A Novel Sparse Compositional Technique Reveals Microbial Perturbations.” MSystems, vol. 4, no. 1, 12 Feb. 2019.
Written by Yash Garodia [1]; Rachel E. Diner, JD, PhD [2]; PI: Jack A. Gilbert, PhD [3]
[1] UC San Diego, B.S. General Biology, Class of 2022, Revelle College; [2] UC San Diego, Postdoctoral Scholar, Gilbert Lab UC San Diego, La Jolla, CA, USA; [3] Department of Pediatrics and Scripps Institution of Oceanography, UC San Diego, La Jolla, CA, USA